


Rates of evolution - How do we measure large changes?
Survivorship curves
Survivorship curves are another way of measuring the taxonomic rate of evolution.
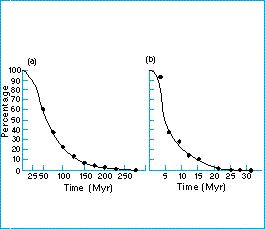
These are constructed by taking a sample of mammalian genera and measuring how long each one lasts in the fossil record. (Any taxonomic levels can be used: mammalian genera are just an example.) The survivorship curve plots the number of genera surviving for different times: as the figure shows most of the genera are still surviving after a short time, but as time passes the members of the original sample drop out one by one. The slope of a survivorship curve measures the rate of evolution of the group. If the group is evolving fast, the survivorship curve falls rapidly as a taxonomist does not recognize a species as surviving for long; the curve is more drawn out for a slowly changing group.
Figure: survivorship curves for (a) bivalves and (b) carnivores. The curves express the numbers of genera surviving for different amounts of time. Note that bivalve genera tend to last longer than carnivore genera, as is clear from the different scales of the x-axis in the two figures. From Simpson (1953).
| Next |