

Rates of evolution - How do we measure large changes?
Lungfish have not always been 'living fossils'
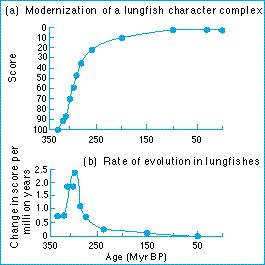
Westolls result is shown in the figure. Dipnoi, it reveals, have not always been 'living fossils'. Around 300 million years ago they were evolving rapidly, but since about 250 - 200 million years ago, their evolution has slowed right down, and their description as living fossils is accurate for the modern forms.
The division of characters into states, and the assignment of scores to states, is arbitrary. It would be meaningless to compare exact numerical rates of change between characters, or between taxa. The approximate shape of a graph like that in the figure could be compared with another such graph for another group; but there would be no point in asking why one group changed at, say, 2.1 units per million years and another at 1.3 units per million years. The scores are not intended for that kind of analysis. But as an illustration of how rates of change in lungfish have risen and fallen and declined to a virtual standstill, Westoll's analysis is a classic.
Figure: evolution in lungfish: (a) shows the total score for each fossil. The rate of evolution is the slope of the graph: when the graph is flat, evolution is not happening. In (b) the rate of change of the score through time is shown.
| Next |