

Evolutionary biogeography - How are flora and fauna distributed across the globe?
Indexes of similarity
The division into regions was made according to the degree of similarity between the lists of the species living in the various places. Biogeographic similarity can be quantified by various indexes of similarity. One of the simplest indexes is Simpson's index.
If N1 is the number of taxa in the area with the smaller number of taxa, and N2 is the number of taxa in the other area, and C is the number of taxa in common between the two regions, then Simpson's index of similarity between the two areas is:
C/N1
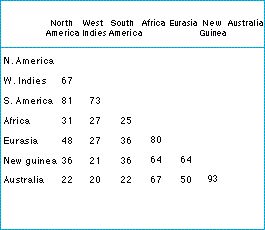
The table opposite gives the faunal similarities, for mammalian species, between several regions (here they are expressed as percentages: that is, (C/N1) x 100). The indexes in the table show some of the justification for the division of the Earth into faunal regions we have just seen.
For example, the faunas of Australia and New Guinea are 93% similar, whereas those of New Guinea and the Philippines are only 64% similar: the Philippines have as high a similarity with Africa as they do with New Guinea. This Indonesian discontinuity corresponds to the Wallace line, which can be seen in map on the previous screen. It was not properly understood until the discovery of continental drift.
Table: indexes of similarity (%) for the mammalian species of various regions. Data from Flessa et al (1979).
| Next |