

Classification and evolution - What are the three main schools of classification?
Applying numerical phenetics
There are several methods for aggregating a large number of measurements into a combined measure of phenetic similarity.
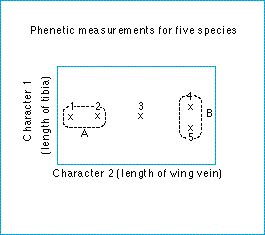
Start with two characters; suppose that we wish to classify a group of fly species, and we have measured two characters, such as the length of a certain wing vein, and the length of the tibia of the hind-leg. As the figure shows, the average for each species can be represented as a point.
For any pair of species, the average difference in their wing vein lengths is the distance between their points on the x-axis, and the difference between the lengths of their tibiae is the distance on the y-axis: if we used either character by itself, the classifications would differ; species 1 and 3 for instance have identical tibial, but different wing vein, lengths. The aggregate difference for the two characters can be measured simply by the distance between the two species in the two-dimensional space. The species are then classified by putting each with the species, or group of species, that it has the shortest distance to.
If we measured a third character it could be drawn as a third dimension into the screen; now each species would be represented by a point in the three-dimensional space; the aggregate distance between the species could be measured as before by the distance between the species' points. In this way we could measure dozens of characters and the distance between them as a straightline through hyperspace.
Figure: the phenetic similarity between species can be shown. Here, five species have been measured for two characters, length of wing vein and length of tibia. The distance between the two species on the graph is the phenetic distance between them.
| Next |